We will cover some of it today and the rest on Wednesday.
Before we get started let's review:
1) Remember that in the labor market the roles of supply and demand flip. So Demand in the labor market is the business demanding resources.
Supply in the market is households supplying resources. So when we are talking about Supply of Labor we are talking about people going to work.
2) For some reason, after we do unit 4, students start trying to wedge it in to every other problem. Unit 4 is only for the resource market. Don't forget everything that has come before.
On to the supply of labor!
We confirmed last week that the Labor MARKET graph is just what we expected. It is a standard market X.
We then learned that for an individual firm in the labor market Demand line is just a downward sloping line. However, we don't actually call it a demand line, we label it as MRP or Marginal Revenue Product.
So, it doesn't matter what else is going on in the question, the way you draw the "demand" part of a labor graph is like this:
Now we move on to supply.
It turns out there are three different types of markets for the supply of labor. This is kind of like how there are four market structures in the product market (Perfect Competition, Monopolistic Competition, Oligopoly and Monopoly).
HOWEVER, it should be noted that there is NO correlation between the market structures in the product market and the market structure in the labor market. Any one of the 4 product markets can like to any one of the 3 labor markets.
Today we will handle the first of the three. Then tomorrow we will handle the other two, which are related.
So today we have the Perfectly Competitive Supply of Labor (PCSL).
A PCSL should stir up memories of Perfect Competition. An individual firm in Perfect Competition in the PRODUCT market can produce as many of a product as it wants. That makes its individual demand line perfectly elastic/horizontal.
An individual firm in a Perfectly Competitive Supply of Labor in the RESOURCE market can HIRE as many workers as it want. It has a perfectly elastic/horizontal SUPPLY. Only just like we labeled the Demand line differently and called it Marginal Revenue Product (MRP), we also label the supply line as the Marginal Cost of Labor (MCL) or Marginal Resource Cost (MRC) or Marginal Factor Cost (MFC). (Note once again that we only use MCL if we are actually talking about labor. If you are talking about a different resource, don't use MCL. Use MRC or MFC instead.)
So instead of MRDARP (like in the Product Market) we have SMCL in the resource market for a PCSL.
So the graph of the MCL for an individual firm in a PCSL looks like this:
It means a firm can hire as many workers as it wants at the current wage.
What about that MCL line?
MCL is the Marginal Cost of Labor. It means how much more cost do I incur when I add an additional unit of labor?
Let's say the wage was $11 an hour. If I hire another person how much more will it cost me? It will cost $11 more an hour. And if I hire another person after that? $11 more an hour.
In fact, that is true for every worker I hire. The marginal cost of hiring another person is always $11. It doesn't matter how many I hire. I doesn't matter which worker it is. The MCL is always $11.
NOTE that this is NOT true in the labor market as a whole. The Supply line in the labor market is upward sloping. (Scroll up 3 graphs.) But for the individual firm, this is true.
This should again be bringing back memories of a MRDARP line. Only MRDARP is DEMAND and the SMCL is SUPPLY.
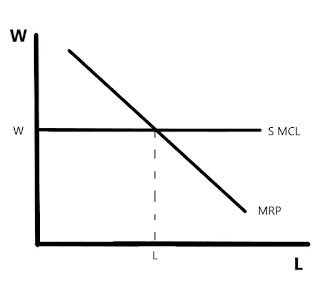
Let's put our two lines together on one graph. When we do, we get this:
Following our golden rule of econ, in the labor market we look for MRP = MCL (or MRC or MFC).
Where they cross we go down to find the quantity of labor we will hire.
Because of our horizontal line we know that regardless of where the two lines cross the wage will be "W".
Our graph is also similar to the PRODUCT market in another way. It is also similar in that we can draw a market graph and a firm graph side by side and show how the firms graph is determined by the market. (As before we should put a dotted line between the two to show that one is controlled by the other.)
It looks like this:
Note how the X of the labor market determines the wage and how many workers will be hired in the entire market.
Then the dotted line shows how the individual firm is a "WAGE TAKER". That firm's MRP line show how many workers they should hire.
And remember, May the 4th be with you, always.


No comments:
Post a Comment